
BI - Business Intelligence

In any case, planning for the future, surviving and growing in tough competitive conditions requires being a company managed with knowledge. At this point, Business Intelligence (BI) presents the methods used to process the raw data of businesses and make them more useful and meaningful.


Today, the most basic feature expected from business intelligence software is that users of every profile in the company prepare their own reports without the need for information processing, and easily share the instant results with their colleagues.

Qlik Sense is a unique data analytics platform that sets the benchmark for next-generation analytics. With its unique relational analytics engine, advanced artificial intelligence and high-performance cloud platform, it contributes to making more accurate decisions based on data in the business world that requires fast decision making.


It enhances the power of human intuition by combining free choice and AI-powered analysis suggestions with automation, helping users of all levels make new discoveries and achieve unexpected results.

Key Features

Uncover what's hidden with drag-and-drop visuals.

Analyze all relationships between data dimensions with a combination of data indexing engine and smart visuals. Discover hidden spots in traditional approaches and classic query-based data models.

Get ultimate flexibility with Smart Search.

Not sure where to start? No problem! Just start typing the words you will search in the "Smart Search" field. Instantly see clues about the data you want to search, and all relevant and non-relevant topics clearly.

Access analytics from any device, anytime, anywhere.

Do not stay away from your data while your daily life continues. While adapting to the device you want without any additional development, you can start your analysis from your desktop computer and continue with your tablet or smartphone.

Streamline self-service with managed data.

Give users of any profile the ability to create their own visual screens, cockpits and reports, while giving IT the confidence that stable, secure and regulated data is being worked on.

Share your findings with Storytelling.

With the Storytelling feature, share the analysis results with visual components, improve your communication and cooperation with your teammates.


Explore multiple data sources in a single app.

Gain a comprehensive view of multiple data sources without sacrificing performance.


Sample Applications

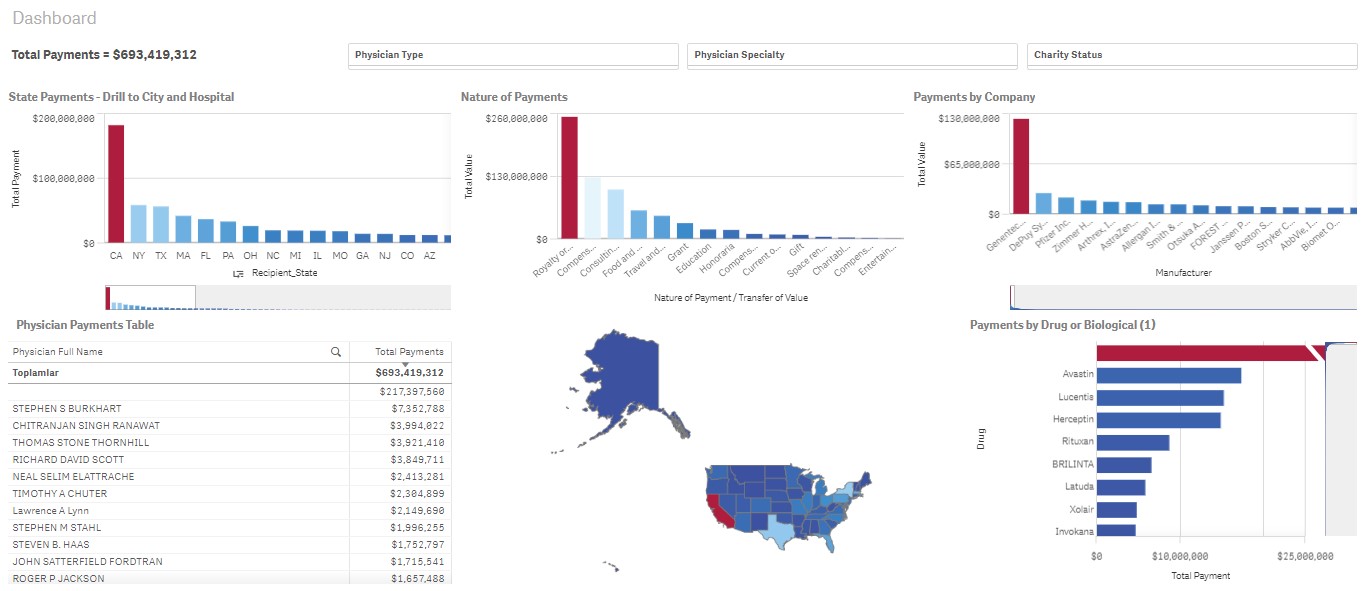
It comprises statistics from the American health-care system that has been made public.

Click For Demo


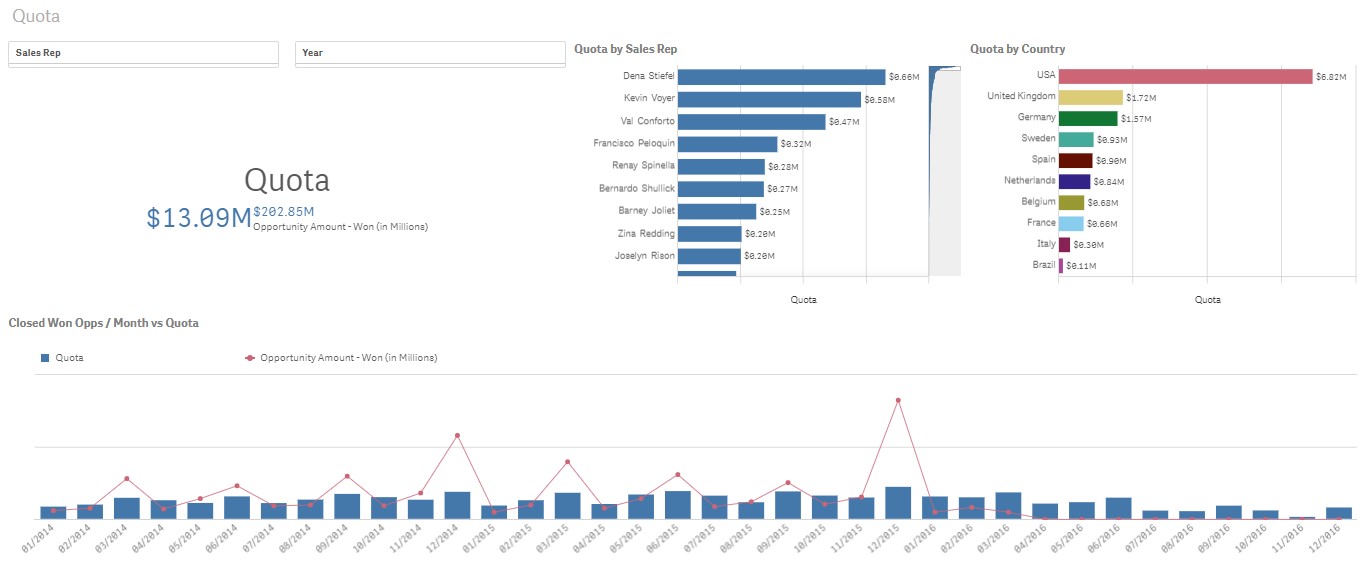
Examine sales representatives' performance in terms of current and future customers.

Click For Demo

Buy
Buy

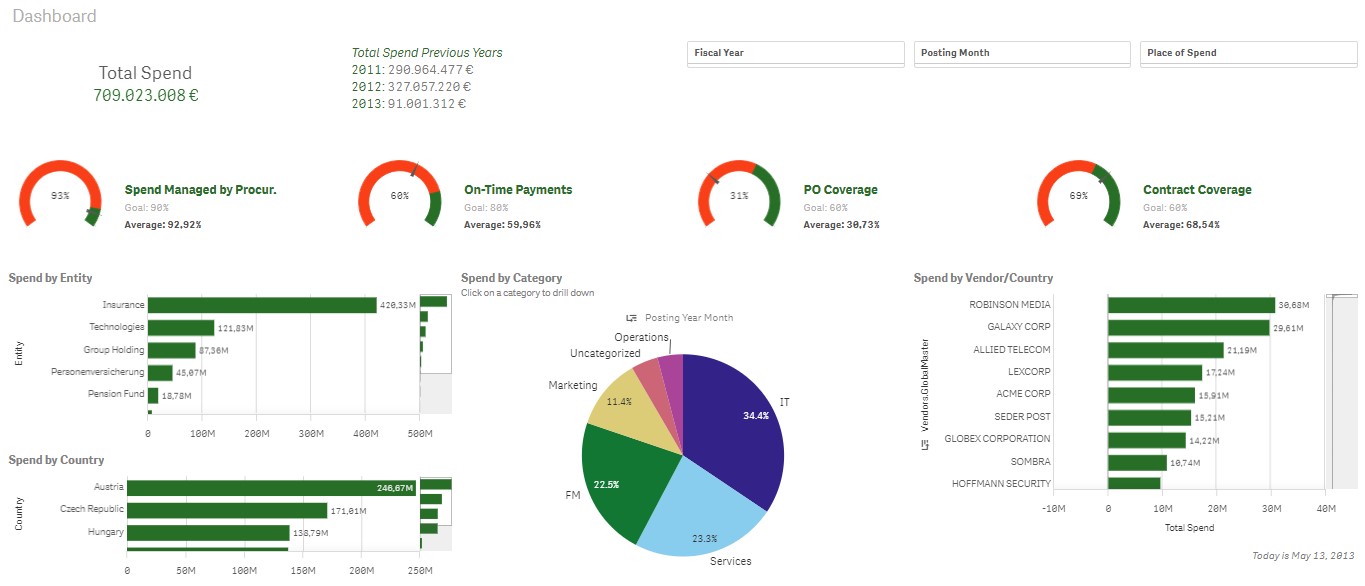
This software demonstrates how a company may examine its purchase process.

Click For Demo

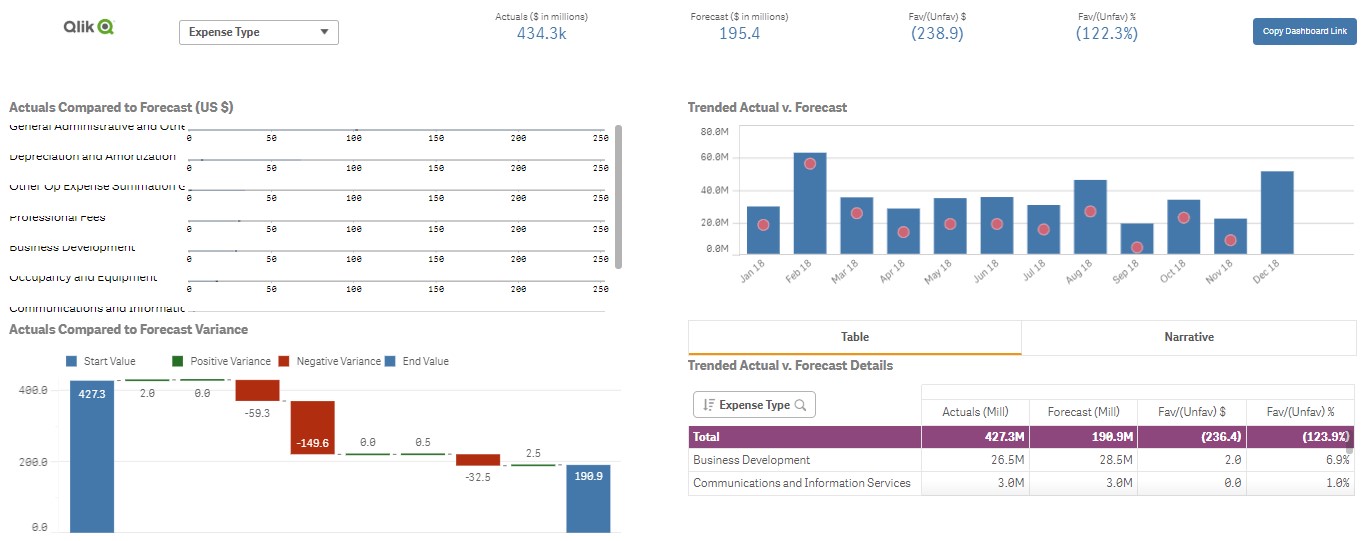
See what you can accomplish with a cash flow software that includes yearly growth, P&L, depreciation allocation, forecasting, Monte Carlo simulations, and more.

Click For Demo


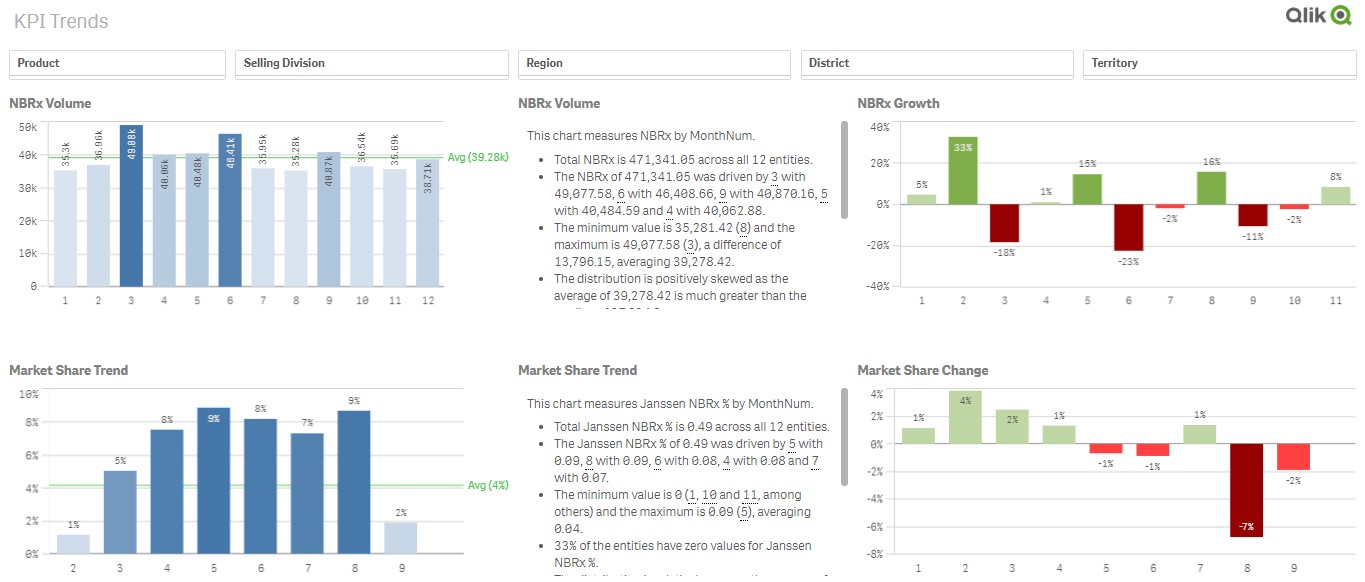
Based on example data from the Health goods market, the program allows users to investigate medication market distribution at the doctor level.

Click For Demo

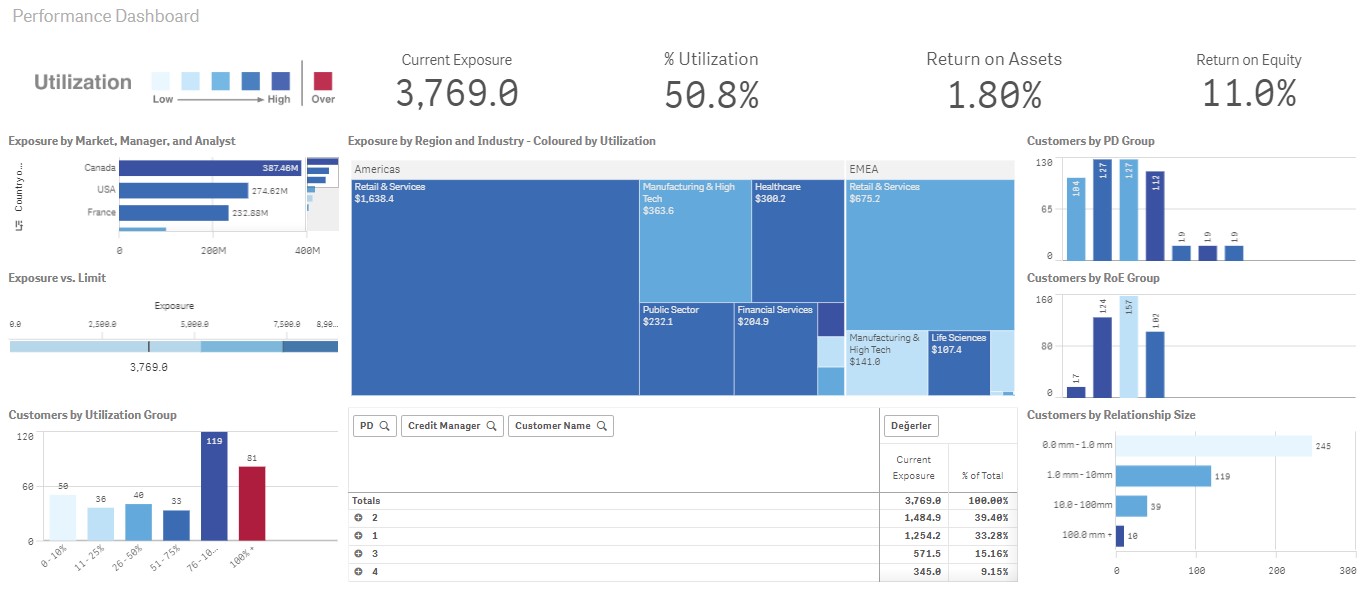
You can show how with this application you can examine the return on equity ratio and investment purpose until it has a useful tool.

Click For Demo